Project management is an essential part of any business, large or small. It involves setting goals and planning how to achieve those goals efficiently and effectively.
One popular method for managing projects is the critical path method (CPM). CPM enables project managers to identify the most important tasks in a project, as well as when they must be completed, in order to ensure that the entire project is finished on time.
In this article, we will look at the critical path algorithm and how it can help you manage your projects more effectively.
Table of Contents
What is the critical path method (CPM)?
The critical path method — or critical path project management — is a project modeling technique designed to help project managers identify the specific tasks that need to be completed in order to complete a project on time.
This project management technique was invented by Morgan R. Walker and James E. Kelley Jr. in the 1950s and is now used by many businesses and organizations to manage complex projects.
CPM creates a sequence of tasks that need to be completed and then determines the amount of time needed to complete each task.
This allows the project manager to identify and manage any potential delays in the project, as well as what tasks need priority attention in order to keep the whole project moving forward.
Why use the critical path method?
There are several compelling reasons why you should use critical path analysis when managing projects.
First, it provides a clear timeline for the project and allows project managers to anticipate potential delays. This helps them adjust their plans accordingly so that the project can be completed on time and within budget.
CPM also allows managers to manage resource constraints and allocate resources to the tasks that are most important to get the entire project finished while also giving them time to prepare for any bottlenecks they may encounter along the way.
Then, CPM makes it easier to manage team members by assigning tasks to different people and setting deadlines for completion via project management software.
This gives each team member clarity on their responsibilities, which can help them stay organized and motivated to complete tasks in a timely manner.
Finally, data gathered from CPM can be used to optimize future projects. As you compare the estimated time durations of tasks against the actual progress, you can adjust estimates accordingly for future projects.
This will help you plan your future projects well and allow you to quote realistic timelines to clients.
Critical path elements
There are several elements that make up the critical path method, including:
- The activity list: This is a list of all the tasks that need to be completed in order to finish the project.
- Estimated durations: This is the estimated amount of time needed for each task to be completed.
- Task dependencies: These are project tasks that must be completed before other tasks can begin.
- Float: This is the amount of time a task can be delayed without affecting the project’s timeline.
- Critical paths: A project’s critical path is the sequence of tasks that must be completed on time for the project to finish on schedule. This is the longest sequence in the network diagram, as we’ll see in the next section.
- Critical duration: This is the total time duration of the longest path in the project.
We can understand these elements better by using an example. So let’s suppose you are managing a project to create a website.
Example: Using CPM to create a website
The activity list would include tasks such as designing the layout, creating content, writing code for the site, and testing it.
You would then need to come up with task dependencies. In this case, writing code for the site might depend on designing the layout, and testing may need to be done after programming.
And while you’re programming and testing the website, you could simultaneously be creating content.
The estimated duration would then be used to calculate the total time it would take to complete each task.
They would also be used to calculate the total duration of the critical path and the float or the amount of time a task might be delayed without affecting the timeline.
How to calculate the critical path?
Once you have determined the activity list, estimated durations, and dependent tasks, you can create a network diagram (or a critical path diagram) to help visualize the project.
A network diagram is a graphical representation of the project activities, which shows the various tasks and their relationships, as well as the overall project schedule.
For example, in our website project example, the network diagram could look something like this:
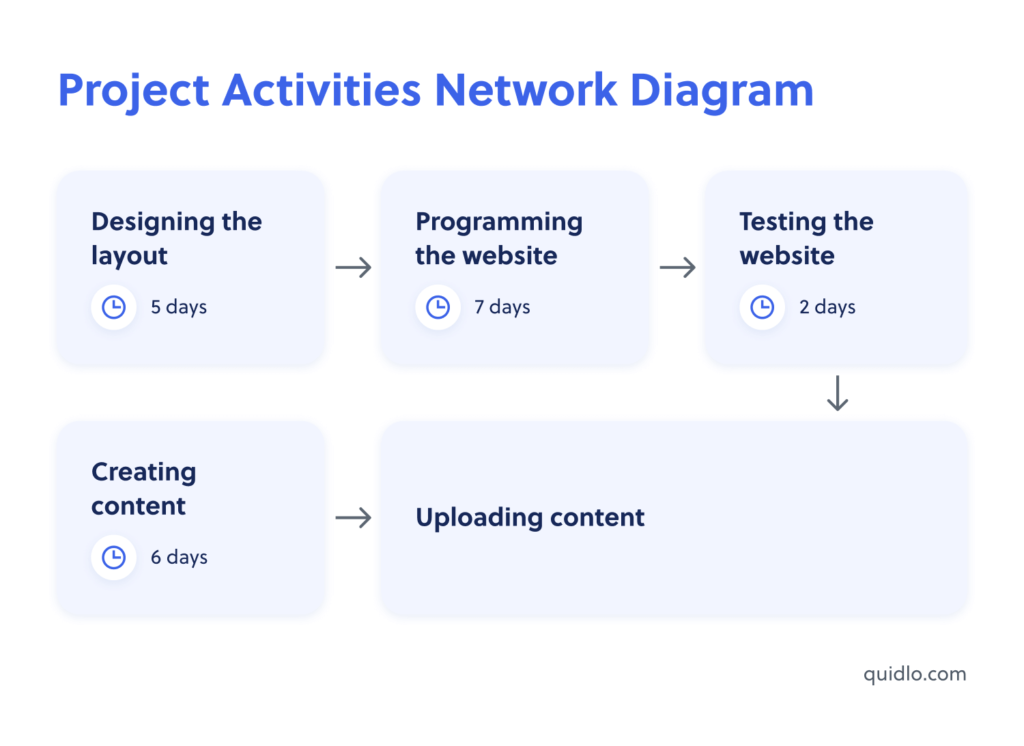
Once you have created your network diagram, you can calculate the critical path of the project by finding the longest sequence of activities in the network. In this case, it’s the sequence that starts with designing the layout and ends with uploading content.
The critical duration is the total time of the longest path. In our website project example, this could be estimated to be 14 days.
Here, you might wonder how to allocate duration to the various tasks in your network diagram. There are several ways to do this. For example, you can use historical data from previous similar projects and adjust for any differences.
You could also estimate duration based on skill and experience or consult with subject matter experts and stakeholders to identify industry standards.
Calculating float
Float — also called slack — is a useful metric that tells you how much a task can be delayed before it affects the overall project timeline.
To calculate float, you must first determine the early start and finish dates and the late start and finish dates for each task.
👉 Using forward pass to calculate early start and finish dates
To calculate the early start and finish dates for each task, you can use something called the forward pass.
The forward pass starts at the beginning of the project and works forward. You basically work out the earliest time each task can begin based on its dependency on other tasks.
For example, in our website project, the earliest time programming can start is when designing the layout is completed.
You then add the estimated duration for each task and keep moving forward until you reach the end of the project.
👉 Using backward pass to calculate late start and finish dates
To calculate the late start and finish dates, you use the backward pass. Starting at the end of the project and working backward, you work out the latest time each task can begin based on its dependency on other tasks.
You then subtract the estimated duration for each task and keep moving backward until you reach the beginning of the project.
👉 Calculating total float
Once you have calculated the early and late start and finish dates, you can then calculate the total float for each task by subtracting the early start date from the late start date.
The result is the amount of time the task can be delayed without delaying the project completion date.
Total float for each task = late start date – early start date
Keep in mind that any tasks falling on the critical path have a total float of zero. That means if any of these tasks are delayed, it will delay the entire project, which is why they’re called “critical tasks.”
👉 Calculating free float
You can also calculate something called the free float for each task. To do this, you subtract the early finish date of a task from the early start date of the task that depends on the first task.
This allows you to calculate the amount of time any task can be delayed without affecting the next task in the pathway.
Free float = early start date of the dependent task – early finish date of the current task
Once again, all tasks falling on the critical path have a free float of zero. That means delaying any of these tasks will delay all the tasks that depend on them (or the entire project).
How to use the critical path
Okay — you now know what a critical path is and how to calculate it, but what do you do with it? Well, there are several ways the critical path can be used to help you manage your projects.
First, it’s important to note that critical path activities should be the focus of your project management efforts.
That means it’s important to track them closely and ensure they don’t fall behind schedule. Any delays on the critical path will delay the entire project, so it’s important to keep a close eye on it.
The CPM can also be used to adjust to any changes in deadlines. You can do this by looking at the network diagram and determining any parallel tasks that could be started simultaneously to help the project stay on track.
This can be helpful if you encounter delays or if any additional tasks need to be added to the project. You can also use the network diagram to identify non-critical tasks that can be skipped to complete the project on time.
What is a Gantt chart, and how is it different from critical path analysis?
If you’re new to the world of project management, you might have heard about a Gantt chart and wondered how it’s different from critical path analysis.
Well, a Gantt chart is a graphical representation of your project timeline that shows each task’s start and finish dates. It’s essentially a visual timeline that helps you track progress and identify any potential delays.
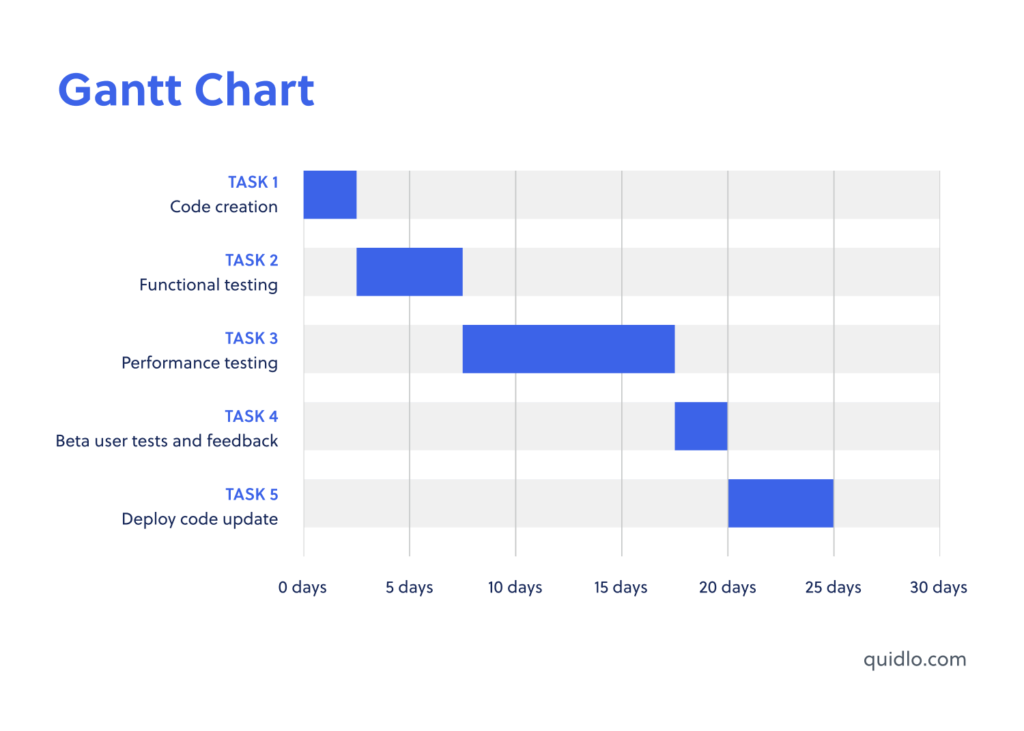
On the x-axis, you have the timeline of your project, and equal distances along the axis represent equal units of time. On the y-axis, you have all the tasks that need to be completed in order to complete the project.
You can also have other elements like milestones and dependencies in your Gantt chart to provide more detail.
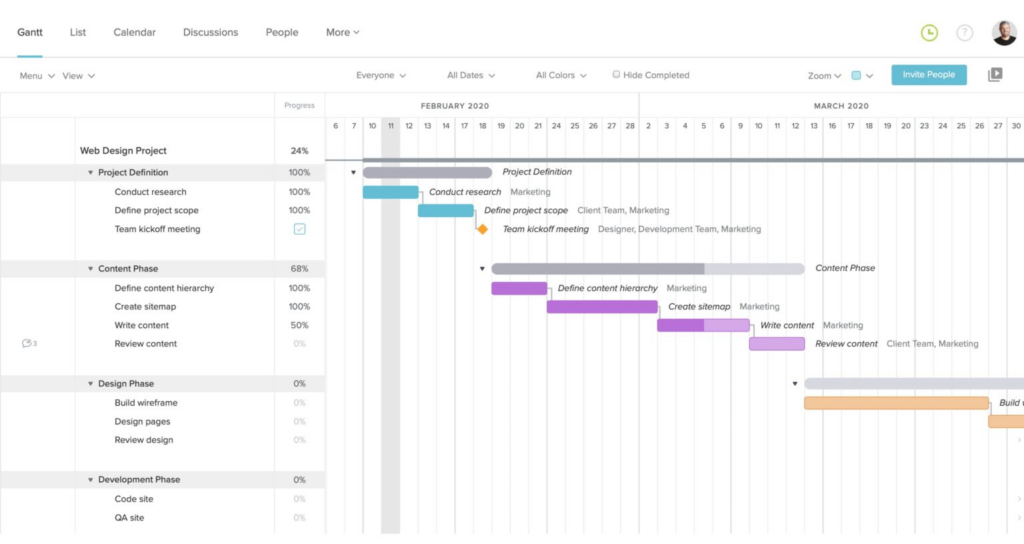
The key difference between a Gantt chart and critical path analysis lies in the purpose. The purpose of a Gantt chart is to show the progress of your project, while critical path analysis is used to identify the longest path through the project and calculate the total duration this path would take.
So, while a Gantt chart can be used to create the timeline of your project, critical path analysis is more of an analytical tool used to optimize its flow.
Both are essential tools in the field of project management, and they can both be used together to ensure the successful completion of your project.
In fact, you can calculate critical paths with Gantt charts, which is actually a critical project management skill you should know.
Helpful tools to calculate the critical path
As you must have guessed by now, calculating the critical path manually can be complex, especially if you’re working on a large project with lots of tasks and dependencies.
Fortunately, there are many helpful project management tools out there that can help you organize and visualize the tasks required by your project to make critical path calculation straightforward.
We’ll list our top recommendations for critical path software in this section, but if you’d rather conduct your own research, make sure the project management software you choose has the following features:
A dashboard where you can get a bird’s eye view of your project and ensure everything is on track.
Task dependencies, which will help you visualize dependent tasks and keep the relationships between them straight. This is critical for calculating the critical path.
Live updates, which will help you stay updated about your project’s critical path at all times, so you can identify and resolve any delays that might arise.
Project insights, which are reports about how your project is running. These can provide you with useful insights that you can use to optimize future projects, making the critical path in project management more meaningful for you.
With that out of the way, here are two critical path analysis tools:
Gantt Charts
Gantt Charts are great for calculating the critical path of smaller projects with dependent tasks, like the website creation project we discussed earlier.
Gantt charts will help establish a timeline of all critical tasks involved in a project, as well as the individuals responsible for each task. It shows details such as the start and end dates, milestones, and dependencies.
Therefore, Gantt charts cultivate accountability between team members while also making the project manager’s work easier.
Pert Charts
You can also estimate critical path using PERT charts. Also known as the Program Evaluation Review Technique chart, the PERT chart is also a graphical representation of a project showing its timeline and tasks.
The graph uses arrows to illustrate the sequence or flow of individual tasks. These arrows also demonstrate the task dependencies.
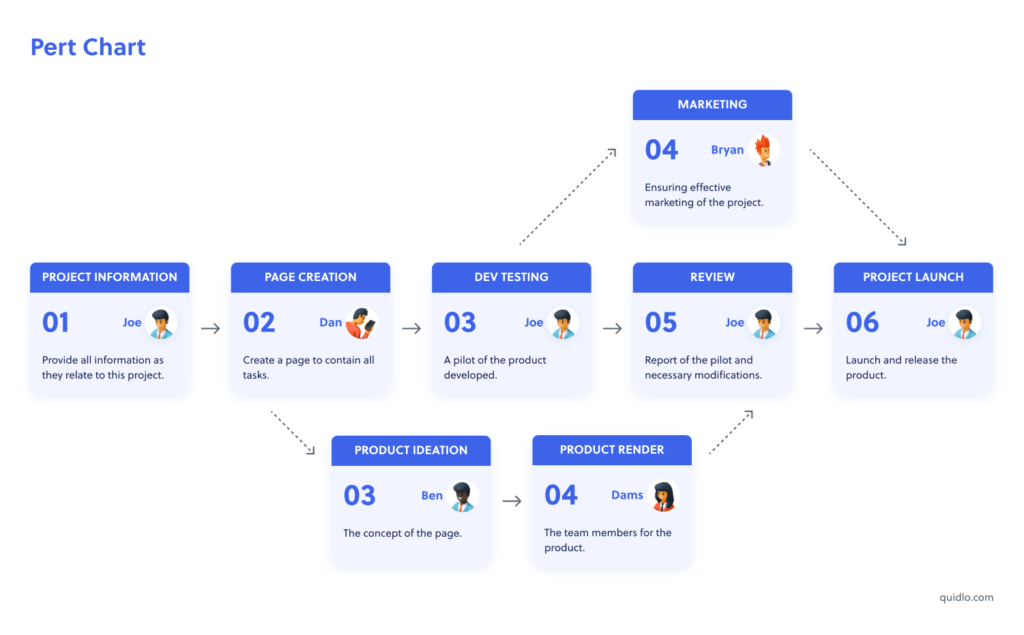
Tasks that are related to other PERT paths can also be included in this chart. These are usually shown in dotted lines, as seen above.
Summary
So, a critical path in project management is the longest sequence of tasks that you must complete in order to complete the entire project.
All tasks falling on the critical path are called critical tasks, and the total time duration it would take to complete them is called the critical duration.
Critical path analysis can help you calculate the float for each task, which is the amount of time you can delay a task without delaying the overall project. This is a very helpful tool for project managers, as it helps them schedule tasks appropriately.
But it’s important to remember that critical tasks have no float, and any delay in them will affect the overall project.
Finally, there are many tools that can help you analyze your critical path. We’ve listed the two options above. Some of these can also be accessed through most project management tools.